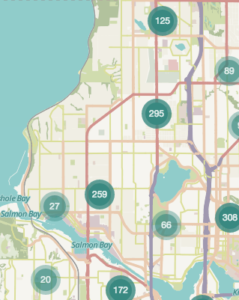
 A local website developer has built a data visualization tool that shows traffic collision information by neighborhood.
Tim Ganter created the website using information gleaned from the Seattle Department of Transportation collisions website. He breaks down the data by neighborhood, comparing not only the number of collisions, but also the resulting injuries and the cost associated, the number of people, cars, and pedestrians or cyclists involved, causes of collisions, and even the weather on the day of the collisions.
For example, since the beginning of the year, there have been 4,695 collisions in Seattle, involving 6,732 vehicles, and 9,310 people, resulting in eight fatalities and 44 serious injuries. The data shows that 28.59 per cent of collisions happened on rainy days; 49.24 per cent were on partly cloudy or clear days.
In Ballard, perhaps unsurprisingly, most collisions happen along NW Market St. Since the beginning of 2017, there have been 17 collisions on NW Market St east of 20th Ave NW, and 32 collisions near the intersection of 15th Ave NW. Ganter’s website is highly detailed; using an interactive map, it’s possible to zoom in on each individual accident to learn the details such as the number of people involved and the weather at the time of the collision.
Ballard’s collision page shows that the average number of collisions per month in our neighborhood is 23, according to 10 year’s worth of data. The most common type of collision over the past 10 years has involved a parked car (873), with rear-ending the second most common (528).
Our neighborhood actually ranks quite low on the number of overall collisions in the past decade; Ballard is 15th out of 103 Seattle neighborhoods counted. However, we’re 5th on the list for number of parked cars hit.
Ganter is further developing the site, one day hoping to provide a geolocation tool so users can search for nearby collisions.
Screenshot courtesy http://seattlecollisions.timganter.io/collisions
